
The Sepia Toned Photograph and Sea-Level Rise
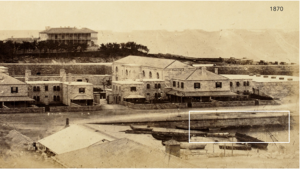
An interdisciplinary team of scientists, led by Philippe Rouja, anthropologist with the Bermuda Government Department of Environment and Natural Resources, used biological evidence in a historical photograph of the Royal Naval Dockyard to measure local sea-level rise in Bermuda. While looking at the photo, which was taken in 1870, the team noticed a discernable black line of cyanobacteria (shown in the white rectangle, above) running along the dock wall parallel to the surface of the water. (Photo source: Bermuda Archives, Photographic Views Bermuda, Arthur Green Collection, CS, 6/1/9 – Governor’s Dispatches, Executive N018, Colonial Secretary, Secretary of State for the Colonies to the Government of Bermuda, Plate 12-SCR322.)
A photograph taken over 150 years ago, originally intended to document British overseas military installations in Bermuda, is now a historical reference point helping scientists measure the impacts of local sea-level rise. Although the subjects of the photograph were the Commissioner’s House and various fortifications along the slip in the Royal Naval Dockyard, the image also captured a fixed biological phenomenon that can be used to interpret sea-level: a stable community of cyanobacteria that lives just above the high-water mark.
An interdisciplinary team of scientists and engineers, led by Philippe Rouja, cultural and medical anthropologist with the Bermuda Government Department of Environment and Natural Resources, used this “black zone” of cyanobacteria to establish a reliable reference point for early sea-level measurements in Bermuda. The results of their work, published recently in the International Journal of Maritime History, suggest that Bermuda may see regional variability in sea-level rise.
“Sea-level rise is not a mystery and certainly this paper does not tell us something scientists and many people don’t already know,” Rouja said. “That said, I think the publication is significant as an interdisciplinary piece of work that shares the less-communicated but equally important aspects of the scientific process. Creative happenstance, camaraderie of good teams and being with like minds can lead to discovery, innovation and invention and make doing science, even when dealing with serious subjects, quite enjoyable.”
Searching for Signs of Sea-Level
Sea-level rise is both one of the most invisible (in that it occurs in small increments over time) and potentially most serious consequences of climate change, particularly for low-lying and coastal regions of the world. For Bermuda, where over 20 percent of the island’s land mass sits at elevations less than 6.5 feet (2 meters) above sea level, even relatively small increases in sea-level could have significant negative environmental impacts.
To study the local impacts of recent sea-level rise on Bermuda, Rouja, who is also an Adjunct Faculty member at BIOS, teamed up with archivist Mandellas Lightbourne (Bermuda Archives); marine scientist Steven Blasco and founding trustee Wendy Tucker (Bermuda Underwater Exploration Institute); biologist Craig Schneider (Trinity College, U.S.); engineers Falko Kuester, Eric Lo and Vid Petrovic, and archaeologist Dominique Rissolo (University of California San Diego, UCSD, U.S.).
In describing this collaboration Rouja said: “Everyone talks about the benefits of interdisciplinary science, it is something most scientists aspire to in some form, but it isn’t every day that an anthropologist gets to talk with a climate geologist or a marine algae expert, never mind professionals who have specific experience in photogrammetry and cutting-edge image analysis. And, of course, it requires a resource like the Bermuda Archives to be curating and preserving a unique historical data set and to be open to the public and the many kinds of public enquiry into their records they get daily.”
During their search for historical sea-level references, the Bermuda Archives uncovered a high-quality military photograph taken in 1870 of buildings in the Royal Naval Dockyard, on the western tip of Bermuda. Captured in the photograph was the sheltered, south-facing dock wall, still in existence today due in part to its construction from blocks of dense Bermuda limestone, as well as decades of historical preservation efforts.
While the tide level at the time of the photograph was unknown, the team noticed a solid black line running the length of the dock wall, parallel to both the surface of the water and the top of the wall. Known as the “black-zone,” (or the “coastal scum line” as Rouja calls it) this stable community of cyanobacteria thrives in a very specific location: just above the mean high-water mark.
Bermuda’s Black-Zone
A visit to Dockyard in 2007, the year the photograph was found, revealed the wall was still very much intact, along with the black-zone line running the length of it.
“However, we quickly noted that there was one significant difference: the black-zone sat approximately one full block higher than it did in the 1870 photograph,” Rouja said.
Inspired by historian and explorer Teddy Tucker, described by Rouja as “an intrinsically curious multidisciplinary ocean elder,” and his early work using Bermuda’s submerged cedar forests as evidence of historic sea levels, the team decided the black-zone line could be used as a measure of sea-level rise.
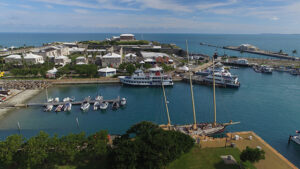
When they returned to Dockyard to investigate the same wall in 2007, more than 150 years after the photograph was taken, the line was still there, only it had shifted higher up the limestone wall. This stable community of cyanobacteria is called the “black-zone” and thrives in a very specific location: just above the mean high-water mark. The fact that the black-zone line shifted upward was an indication that sea-level had also gone up. (Source: Philippe Rouja)
They estimated that in the 150 years from 1870 to 2007, the black-zone on the wall rose approximately 33 to 41 cm, or 2.4 to 3 mm, each year. At the higher end, this is close to the average annual sea-level rise of 3.1 mm calculated by the International Panel on Climate Change; at the lower end, it approximates the average annual sea level rise of 2.17 mm measured by the St. George’s, Bermuda tide gauge, which was installed in 1932. Seeing the potential for black-zone lines to be used as a proxy for long-term sea-level rise, the team decided to gather more information about its application on shorter timescales.
History Goes High-Tech
In 2017, they created a “digital twin” of the seawall using a variety of data sources, including over 200 photos taken in 2007, a drone-based aerial image set, and a high-resolution handheld photo survey of the seawall—in all, over 1,200 images and 144 million reference points. The historical photo was then aligned to this reference twin, allowing for relative measurements to be made from 1870 to 2007 and again from 2007 to 2017.
“It was only because we were digitizing shipwrecks with Kuester and his team at UCSD that the idea came up of modeling the wall and creating a modern digital twin that could be compared almost perfectly with the historical image,” Rouja said.
With this new, more precise, method of measuring the black-zone line, the team was able to confirm that the rise in sea level from 1870 to 2007 was, indeed, in line with changes in global and local sea levels. Their analysis placed the black-zone line 31.2 cm higher in 2007, which averages to a rise of 2.28 mm each year, close to the reported average of 2.17 mm each year measured by the St. George’s, Bermuda tide gauge. However, from 2007 to 2017, the black-zone line shifted an additional 8.8 cm, or 8.8 mm each year, which is significantly higher (305%) than the average annual sea level rise of 2.17 mm reported by the St. George’s, Bermuda tide gauge.
The difference may be due to “local impact factors” that change the dynamics of regional sea-level rise, such as coastal geomorphology, seafloor topography, and ocean circulation patterns.
In the original 1870 photograph, five mortar lines were visible above the black-zone; in the 2007 photograph, only four mortar lines were visible above the black-zone. The team estimated that in the 150 years from 1870 to 2007, the black-zone on the wall—and therefore sea-level—rose approximately 33 to 41 cm, or 2.4 to 3 mm, each year. For reference, the International Panel on Climate Change calculated an average global rate of sea-level rise during that period to be 3.1 mm, while the St. George’s tide gauge, which was installed in 1932, measured an average annual sea level rise of 2.17 mm.
That dramatic departure from the average rate of sea-level rise carries some additional significance. The black-zone line represents the highest tide experienced and the 2017 height mirrors the highest spring tide ever recorded in Bermuda. Over the longer term, the black-zone line shows the average change in sea-level, but on shorter time scales (such as the 10-year period between 2007 and 2017) it shows changes in tidal amplitude—how high the tide rises above the average sea-level.
“We worry about averages over the long term but increases in amplitude, or dramatically higher tides, can impact us much sooner than the average change might suggest,” Rouja said.
Information such as this on regional impacts of sea-level rise is particularly useful in the development of climate change adaptation and response strategies. This includes management and policy decisions to help address the first noticeable impact of sea-level rise: more frequent flooding of lower-lying coastal areas during high tides.
“Science, in a sense, is an effort to allow us to make better decisions,” Rouja said. “Having more people aware of the past and future impacts of sea-level rise will allow us to be better prepared.”